This posting is obviously late. Have not been available since Christmas day due to interstate travel.
I do not have acess to data.
Will resume posting on a timely manner from 2 January 2012.
I take this opportunity to wish you all a prosperous 2012 and hope that Santa was good to you all.
Saturday, 31 December 2011
Wednesday, 21 December 2011
Sunday, 11 December 2011
SP500 16 DECEMBER 2011
TARGET FOR 21 DECEMBER 2011
1350= 5 MAY = 0 days
1260= 21 JUNE= 45 DAYS
1170=5 AUGUST=90DAYS
1170=21 SEP=135DAYS
1260=5 NOV=180 DAYS
21 DECEMBER = ??? 225 DAYS =
Friday, 2 December 2011
SP 500 Decmeber 1 to 8
We shall see what the first quarter moon( 2 Dec) triggers. 1350-(205x1/2)=1244.50
SP 500 CASH HAS JUST CLOSED AT 1244.59
21 December 2011
5 May = 1350 = 225
21 June =1260=180
5 August =1170-1260=135
21 September=1170-1215=90
5 November=1260=45
My estimate is 1305
Friday, 25 November 2011
SP500 NOVEMBER 25 TO DECEMBER 2
Reluctantly please find next weeks projection for the week ending 2 December 2011.
The price projection for 30 November 2011 is 1147.
Given the European Financial situation anything may be possible.
The projection for the 2 December will either be heroic or totally idiotic.
Time will tell..........no I do not have a target.
Best wishes and good luck.
TRADE WITH A STOP!!!!!!!
The price projection for 30 November 2011 is 1147.
Given the European Financial situation anything may be possible.
The projection for the 2 December will either be heroic or totally idiotic.
Time will tell..........no I do not have a target.
Best wishes and good luck.
TRADE WITH A STOP!!!!!!!
Friday, 18 November 2011
SP 500 November 21 to 25
Will publish a price projection if and when I have worked it out
Good Luck and trade with a stop!!!!!!!!!!!!!
Friday, 11 November 2011
SP 500 NOVEMBER 11 TO 18
NEXT CIT IS 28 NOVEMBER TO 2 DECEMBER 2011
TARGET
FROM 5 MAY 1350 = 203= 1147
FROM 5 AUGUST 1260 = 113 =1147
THEREFORE TARGET 1147???
WE WILL UPDATE AS WE PROGRESS
TIME WILL TELL
Friday, 4 November 2011
Friday, 28 October 2011
Sunday, 23 October 2011
SP 500 update 24 to 28 October 2011
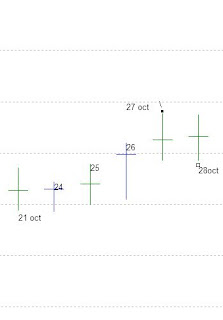
Next CIT is 28-31 October 2011
4-8 NOVEMBER TIME FRAME
5 NOVEMBER 2011=
180 days from 5 May (1350)
135 days from 21 June (1260)
90 days from 5 August (1170 to 1260)
45 Days from 21 Septmber (1170 to 1215)
5 NOVEMBER TARGET= LOOKS LIKE 1260 TO ME?
MONITOR 4X1 AND 2X1
REMBER TRADE WITH A STOP!!!!!!!!!
REMBER TRADE WITH A STOP!!!!!!!!!
Monday, 17 October 2011
Thursday, 13 October 2011
Monday, 10 October 2011
SP500 November 2011
21 March 2011 = 1260
5 May 2011 = 1350
21 June = 1260
5 August = 1215 and 1170
21 September = 1170 and 1125
5 November = ?????? to be advised
5 May 2011 = 1350
21 June = 1260
5 August = 1215 and 1170
21 September = 1170 and 1125
5 November = ?????? to be advised
Monday, 3 October 2011
Thursday, 29 September 2011
SP 500 28 Sep 2011
Cycle within a cycle
As per my previous post 3-4 October looks interesting
Trend appears clear
My sell limit at 1190 failed to execute as the high last night was 1186
DO NOT FORGET TRADE WITH A STOP!!!!
Cycle within a cycle
As per my previous post 3-4 October looks interesting
Trend appears clear
My sell limit at 1190 failed to execute as the high last night was 1186
DO NOT FORGET TRADE WITH A STOP!!!!
Tuesday, 27 September 2011
sp500 update 27 September 2011
The model suggests a pullback from the 27the of September
The model suggests a greater pullback from the 3 October
The gradient above the blue line being 8 x 1 is difficult to maintain.
Trade with a stop
The model suggests a greater pullback from the 3 October
The gradient above the blue line being 8 x 1 is difficult to maintain.
Trade with a stop
sp500 to 4 October
My fractal model suggests long until 4 October 2011 as per my previous posting.
I will post a a chart later today
I will post a a chart later today
Sunday, 25 September 2011
Thursday, 22 September 2011
Monday, 19 September 2011
SP 500 to 23 Sep 2011 Target 1215 or 1170
21 March = 1260 to 21 September is 180 Days.Therefore 1260 minus 180 x 1/2 equals 1170.
5 May = 1350 to 21 September equals 135 days = 1215
21 June = 1260 to 21 Sept = 90 = 1170 then at 1/2 = 45 =1215
5 August =range 1215 to 1170 = 45 days to 21 September = double bottom = 1170 or 1215.
Monday, 12 September 2011
Tuesday, 30 August 2011
SP 500 August 29 to 12 September
always trade with a stop

Monday, 8 August 2011
Thursday, 21 July 2011
Tuesday, 12 July 2011
SP 500 July 11, 2011
Wednesday, 22 June 2011
SP 500 For 22 June 2011 and 5 August 2011
Further to my previous post the following information is provided for consideration.
1260 as stated previously is strong support for the SP500 being 1080 + 180 and refer 21 March 2011 and 20/21 June 2011.
The 5 May 2011 is 45 days in time from 21 March 2011 and 90 points in price amounting to 1350 on the 2 x 1 angle.
The 5 May is also 45 days in time to the 21 June 2011 resulting in 1260 in price using the 2 x 1 angle creating an isosceles triangle.
The SP500 rallied on 21 June and therefore confirmed the 1260 Level as support and a double bottom.
The next price target that must be considered is 1305 being about 45 days in price and time from the 1350 level occurring on the 5 May 2011 near the target date of around 21/22 June 2011.
90 Days from 5 May 2011 will be 5 August 2011. Using the 3 x 2 angle may result in a target of 1215 which is also 45 days in time and price from 1260 on 20/21 June 2011.
The next few days should be interesting especially if the price target of 1305 is achieved and does not hold as resistance may be encountered.
We will all hold our breath to the 5 August and await 1215 if 1305 is achieved in the next few days!!
WARNING THIS IS NOT ADVICE AND YOU CANNOT RELY ON IT.
Monday, 20 June 2011
SP 500 Projection 21 June 2011 and 5 August 2011
It is extremely difficult to make accurate forecasts and I therefore reluctantly provide the following projection:
Based on my mathematical model I am expecting the following Time and Price Targets:
21 June 2011 Expected Price for the SP 500 is 1260.
This is 90 points from the top of 1350 on the 5 May in 45 days being 2 x 1 line.
It is also 90 days from 21 March being a double bottom as well as 630 days from 21 September 2009 (price being 1080).
My model suggests that 1260 IS EXTREMELY STRONG SUPPORT.
IF 1260 SUPPORT IS BROKEN on or after 21 JUNE then the next important date is 5 August 2011.
This date being 5 August is 135 days from 21 March and 90 Days from 5 May and 45 Days from 21 June.
The Target price for 5 August is 1215 being a previous double top.
The rule a previous top becomes a bottom may eventuate.
WARNING. THIS INFORMATION IS NOT TRADING OR INVESTMENT ADVICE.
YOU CANNOT RELY ON THIS INFORMATION AS A BASIS FOR YOUR TRADING DECISIONS AND YOU MUST CONSULT A LICENSED INVESTMENT ADVISER BEFORE UNDERTAKING ANY INVESTMENT
BE CAREFUL AND TRADE WITH A STOP
Thursday, 16 June 2011
SP 500 16 June 2011
Low for the day was 1261.90 almost 1260.
There should be support from 1254 to 1260 which is is also a double bottom.
My cycle projection could be out by 1 day and therefore I am considering closing my short position on the SP500 and watching. IF IN DOUBT GET OUT!! AND ALWAYS TRADE WITH A STOP.
There should be support from 1254 to 1260 which is is also a double bottom.
My cycle projection could be out by 1 day and therefore I am considering closing my short position on the SP500 and watching. IF IN DOUBT GET OUT!! AND ALWAYS TRADE WITH A STOP.
Tuesday, 14 June 2011
Monday, 6 June 2011
Subscribe to:
Comments (Atom)


